Financial Highlights
In 2016, we returned solid results despite facing many challenges in the global marketplace. Our business model, based on customer intimacy and a balanced approach to growth, continues to work well for Quaker.
Our cash at year end was $88.8 million— it exceeded our debt of $66.5 million by $22.3 million.
$100
80
60
40
20
0
Cash
Debt

Quaker has increased or maintained its dividend every year since going public in 1972.
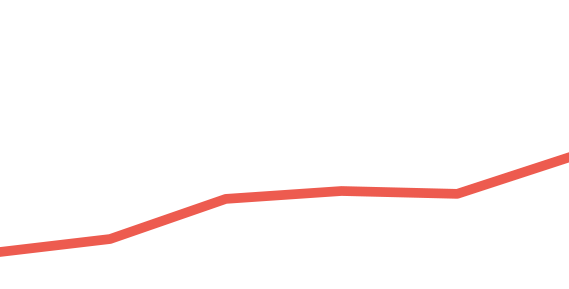
We’ve outpaced the major stock indices over the last five years. Quaker’s total
shareholder return has continued to significantly outperform—yielding a 243%
return to our shareholders since 2011.
COMPARISON OF CUMULATIVE FIVE-YEAR TOTAL RETURN (assumes an investment of $100 on December 31, 2011)


$400
350
300
250
200
150
100
50
Dec'11
Dec'12
Dec'13
Dec'14
Dec'15
Dec'16
- Quaker Chemical Corporation
- S&P SmallCap 600 Index
- S&P 600 Materials Group Index
STOCK PRICE TREND (average share price in dollars)
$100
90
80
70
60
50
40
'12
Avg '13
Avg '14
Avg '15
Avg '16
Avg
Avg '13
Avg '14
Avg '15
Avg '16
Avg
Our stock attained the highest average price...ever. In 2016, our average stock price was $94.74 per share—up 14% compared to $83.29 per share in 2015.
NON-GAAP EARNINGS
PER DILUTED SHARE*
(share price in dollars)
$5.00
4.50
4.00
3.50
3.00
'12
'13
'14
'15
'16
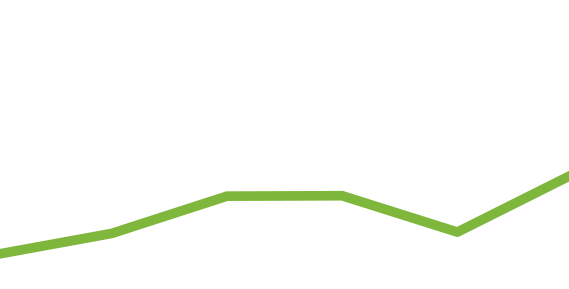
Non-GAAP earnings per diluted share were strong—$4.60 in 2016 compared to $4.43 in 2015.
ADJUSTED EBITDA* (dollars in millions)
$110
100
90
80
70
60
'12
'13
'14
'15
'16
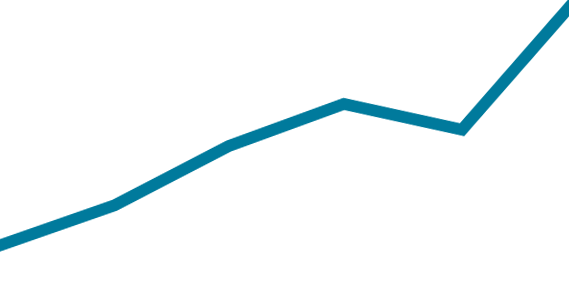
Our adjusted EBITDA grew to a record level—$106.6 million compared to $101.6 million in 2015.
*For reconciliation of non-GAAP items, see the Non-GAAP Measures section of Item 7 in Form 10-K for the years ended December 31, 2016, 2015 and 2014.
